Redwood Studio [Experimental]

Experimental Redwood Studio

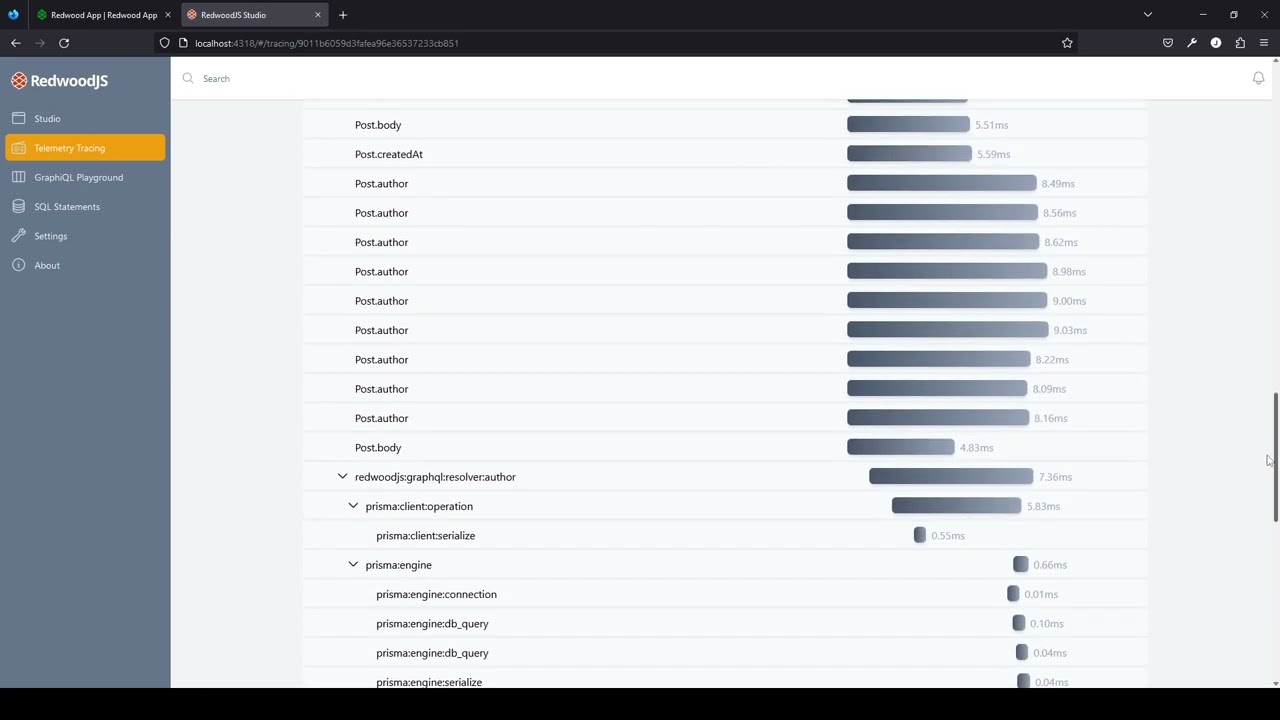
RedwoodJS Studio is an experimental package used during development to gain runtime insights into a project.

Motivation

Redwood provides tools that lets developers "get to work on what makes your application special, instead of wasting cycles choosing and re-choosing various technologies and configurations."1.

Much happens while your app processes a request: Invoke a function; handle a GraphQL request; resolve the request with a service; build and execute a SQL statement; connect to the database; handle the query response; further resolve the response so in contains all the data needed; return the result ā€¦ and more.

While logging can show you some of these steps, there is no easy way to see how they relate to each other, compare, or break down individual timings. Observability needed to debug, iterate, try out, and refactor your code is lacking.

We hope Studio helps solve this problem with an observability tool that combines:

  • Tracing with OpenTelemetry (service and GraphQL)

  • SQL statement logging

  • general metrics (how many invocations)

  • GraphiQL playground with impersonated authentication

With Studio, it is easier to:

  • identify slow running SQL statements without reviewing captured log files

  • identify and improve N+1 queries by comparing before and after traces

  • impersonate the user authentication headers in GraphiQL

Redwood Studio is a command line tool which offers a web UI aimed at providing insights into your application via OpenTelemetry ingestion and other development conveniences like auth-impersonation within GraphiQL.

Demo

Setup

There is no setup needed to begin using the studio; simply execute the following command to start the studio at localhost:4318:

yarn rw experimental studio

or use the exp abbreviation of the new experimental CLI section like so:

yarn rw exp studio

The first time you run this command it will likely install the studio package which may take a small amount of time.

OpenTelemetry
If you want studio to pick up telemetry from you app automatically please ensure youā€™ve setup opentelemetry. A guide on this can be found here

Changes

TOML
The following TOML options are now available which can control the studio behaviour.

[experimental.studio]
  # Determines whether the studio should run with an in memory database or persist the data
  # to a file in your project within `./redwood` 
  inMemory = false

[experimental.studio.graphiql]
  endpoint = 'graphql'

[experimental.studio.graphiql.authImpersonation]
  # authProvider = undefined (default value)
  jwtSecret = 'secret'
  # userId = undefined (default value)
  # email = undefined (default value)
  # roles = undefined (default value)

GraphiQL Auth Impersonation

DbAuth

Requires SESSION_SECRET envar for cookie encryption.

TOML example:

[web]
  port = 8888
[experimental.studio]
  inMemory = false
[experimental.studio.graphiql]
  endpoint = "graphql"
[experimental.studio.graphiql.authImpersonation]
  authProvider = "dbAuth"
  email = "user@example.com"
  userId = "1"

Netlify

Since Netlify does not expose the JWT secret used to sign the token in production, impersonation requires a jwtSecret to encode and decode the auth token.

TOML example:

[web]
  port = 8888
[experimental.studio]
  inMemory = false
[experimental.studio.graphiql]
  endpoint = "graphql"
[experimental.studio.graphiql.authImpersonation]
  authProvider = "netlify"
  email = "user@example.com"
  userId = "1"
  jwtSecret = "some-secret-setting"

Supabase

Requires SUPABASE_JWT_SECRET envar for JWT signing.

TOML example:

[web]
  port = 8888
[experimental.studio]
  inMemory = false
[experimental.studio.graphiql]
  endpoint = "graphql"
[experimental.studio.graphiql.authImpersonation]
  authProvider = "supabase"
  email = "user@example.com"
  userId = "1"

Database File
Studio stores the ingested telemetry to studio.db within the .redwood folder. You should not need to touch this file other than if you wish to delete it to erase any existing telemetry data.

Availability

The setup command is currently available from the canary version of Redwood. You can try this out in a new project by running yarn rw upgrade --tag canary and following any general upgrade steps recommend on the forums.

Limitations

As studio is currently experimental it does not contain all the features youā€™d likely want for tracing visualisation. Existing ingestion/visualisation tools like jaeger might be a better option to fallback on whilst studio matures.

Known Issues

There are a few know issues which we will be addressing shortly:

  1. Prisma query view within the tracing page does not show correct information and lists duplicate entries.

Feedback

Please leave feedback as comments to this forum post. We would love to hear whatā€™s broken, what isnā€™t clear and what additions or changes youā€™d like to see!

We would also welcome any form of collaboration on this feature!
10 Likes

Studio Demo Presentation and Discussion

3 Likes

Super useful work! Thanks a lot! Will definitely try it out soon for Row Level Security and benchmarking GraphQL :slight_smile:

2 Likes

This looks awesome!! Is there a plan to make it possible to deploy this for use in prod?

1 Like

Hey @arimendelow, thanks!

Weā€™ve started with this experimental studio as a dev time tool so we can shape it in to the product people find useful and to iron out the concept/bugs. Ultimately itā€™ll follow the feedback so if this is something people want in prod too then thatā€™s where itā€™ll go! I think it would be cool to have studio along side you at both dev and prod!

We have imagined it could transition into a ā€œcloud studioā€ which could then handle data from any source - dev or prod. There tends to be some scaling issues with telemetry in prod, hence why lots of telemetry services are either very expensive or give you a limited historical window. Weā€™ve got ideas on how to solve those issues though!

Weā€™ve just merged in a few updates; a UI update, some changes to how we organise the OpenTelemetry traces/spans and some initial work on performance insights. Iā€™m going to release a little video update soon. Weā€™re likely going to work on errors next and try to make them easier to detect and debug.

2 Likes

Thatā€™s awesome! Thanks for your work on this :slight_smile:

I used to be part of the telemetry data processing team for a large-scale global platform, so I know first hand some of the challenges you mention. Iā€™m excited to see how Redwood solves them!

2 Likes

Reworked the Studio overview and performance sections to do some metrics and visualizations.

Uses Tremor Line, Bar charts and Bar lists.

Overview counts ā€œspans by briefā€ over time; icon by the type of span.

Performance does some line and bar charts to chart span duration over time with series by the span type:

Is available in latest canary.

6 Likes

Tried to set this up, but getting

ā†“ Please add "tracing" to your previewFeatures in prisma.schema
āœ– Command failed with exit code 1: yarn rw prisma generate
Command failed with exit code 1: yarn rw prisma generate

even if I have it in prisma.schema.

When I try to set up telemetry, I mean.

yarn rw exp setup-opentelemetry

Hey @hakontro! Let me try and help with this one.

We try to regenerate the prisma client as the last step just to make sure prisma knows it should be using that feature. Can you try running yarn rw prisma generate on its own and see if there is any specific error?

This might not be a blocker given itā€™s the last step of the setup and everything else should, hopefully, be good to go. If you run yarn rw exp studio do you see any telemetry - including prisma operations?

Great, thanks!

Cool. Trying to explain it here I think I actually found the issueā€¦ I have a custom generator related to my custom Row Level Security setup, which was failing as part of the ā€œgenerate prisma clientā€-step.

schema.prisma:

generator rls {
  provider = "yarn generate"
  output   = "./generated"
}

package.json:

"scripts": {
    "generate": "node generate_rls.mjs"
  }

generate_rls.mjs:

generatorHandler({
  onManifest: () => ({
    prettyName: 'My Generator',
  }),
  onGenerate: async (options) => {
    const prismaClientDmmf = await getDMMF({
      datamodel: options.datamodel,
    })
    const baseDirectory = 'api/db/migrations/'

    // Find models with the RLS annotation
    const models = prismaClientDmmf.datamodel.models
    const modelsWithRls = models.filter((m) => m.documentation)

    // Check which of the models that already have an existing migration
    const existingModels = getExistingMigrations(baseDirectory)

Problem seems to be that when I run prisma generate from the CLI it runs from the root directory, but if I run yarn rw build or similar my custom script seems to run from the root/api folderā€¦ so it fails if the relaive path is wrong (trying to read migrations from root/api/db/migrations

Command failed with exit code 1: node "/Users/<myuser>/code/sol/node_modules/prisma/build/index.js" generate --schema="/Users/<myuser>/code/sol/api/db/schema.prisma"
Error: 
ENOENT: no such file or directory, scandir 'api/db/migrations/'

Guessing I can javascript my way around this, but thought Iā€™d share anyways

The answer was yes! :beers:

const safedir = fs.existsSync(directoryPath)
    ? directoryPath
    : `../${directoryPath}`
1 Like

Excellent! Let me know if the telemetry doesnā€™t come through as expected :+1:

Works now! Looking forward to explore the app, cool feature! :superhero:

1 Like

Logs are now full of this if I run the app without the studio running, something I can do to avoid that?

api | {"stack":"Error: connect ECONNREFUSED 127.0.0.1:4318\n    at __node_internal_captureLargerStackTrace (node:internal/errors:477:5)\n    at __node_internal_exceptionWithHostPort (node:internal/errors:655:12)\n    at TCPConnectWrap.afterConnect [as oncomplete] (node:net:1247:16)\n    at TCPConnectWrap.callbackTrampoline (node:internal/async_hooks:130:17)","message":"connect ECONNREFUSED 127.0.0.1:4318","errno":"-61","code":"ECONNREFUSED","syscall":"connect","address":"127.0.0.1","port":"4318","name":"Error"}

To avoid those you can turn opentelemetry off in the redwood.toml file, something like:

[experimental.opentelemetry]
  enabled = false

if I remember correctly.

It just needs somewhere to accept the telemetry it generates and by default it assumes thatā€™s on localhost which is where studio would be running. Itā€™s also possible to change where it tries to send telemetry from within the opentelemetry.ts|js file in the api source directory if thatā€™s something you find yourself needing at some point.

Cool, that worked as well.

Guessing itā€™ll be a common case to sometimes run the studio, and sometimes not, so in my case the best thing would probably be to just not do telemetry if studio isnā€™t running.

1 Like

This is amazing! Thank you!

1 Like

Hello - having an issue using rw studio through VS code remote.

I had to use ā€œ::ā€ for web and ā€œlocalhostā€ for api to make yarn rw dev work (I am using supertokens and part of the issue was the JWT callback).
But getting an error when starting rw studio :

input: ā€˜http://:::8910ā€™,
code: ā€˜ERR_INVALID_URLā€™.

Can I force the web url for studio ?

1 Like

Thanks @mat, I donā€™t think Iā€™ve tried this sort of thing yet so Iā€™ll try it out and see if I can reproduce it. Off the top of my head I donā€™t think I made the studio options configurable enough for your needs. If Iā€™m able to reproduce then Iā€™ll add these options since I think we should definitely have that level of configuration.