Experimental OpenTelemetry Support
OpenTelemetry https://opentelemetry.io/
OpenTelemetry is a collection of tools, APIs, and SDKs. Use it to instrument, generate, collect, and export telemetry data (metrics, logs, and traces) to help you analyze your software’s performance and behavior.
OpenTelemetry aims to become the open standard for instrumenting code with logs, metrics and tracing telemetry and they are maturing rapidly and have both stable and successful APIs to prove it. We think that’s a noble aim and aim to offer first class support for OpenTelemetry in the RedwoodJS framework.
RedwoodJS + OpenTelemetry = Easy
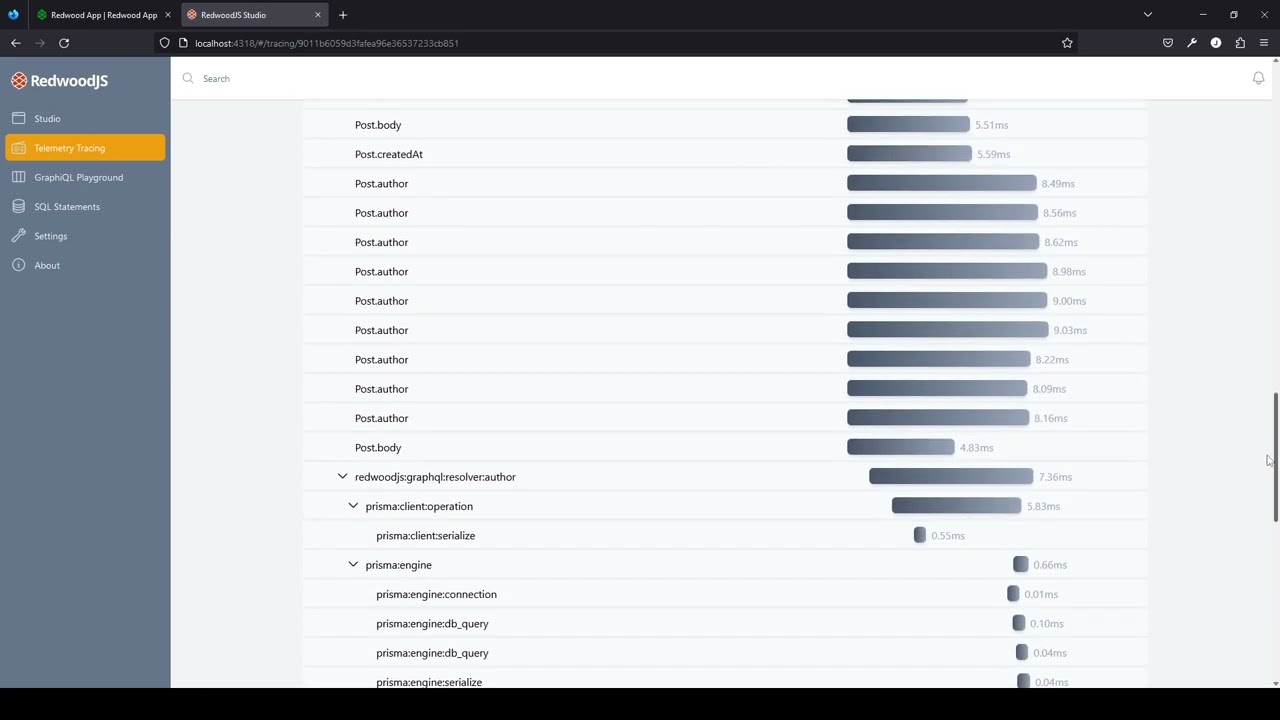
Demo
Setup
To setup OpenTelemetry you can run one simple command:
yarn rw experimental setup-opentelemetry
or use the exp abbreviation of the new experimental CLI section like so:
yarn rw exp setup-opentelemetry
After that you’ll need to update your graphql configuration to include the new openTelemetryOptions option:
export const handler = createGraphQLHandler({
  authDecoder,
  getCurrentUser,
  loggerConfig: { logger, options: {} },
  directives,
  sdls,
  services,
  onException: () => {
    // Disconnect from your database with an unhandled exception.
    db.$disconnect()
  },
  // This is new and you'll need to manually add it
  openTelemetryOptions: {
    resolvers: true,
    result: true,
    variables: true,
  }
})
as this will allow OpenTelemetry instrumentation inside you graphql server.
Changes
TOML
The setup command adds the following values to the redwood.toml file:
[experimental.opentelemetry]
  enabled = true
  apiSdk = "/home/linux-user/redwood-project/api/src/opentelemetry.js"
The enabled options simply turns on or off OpenTelemetry - beware this doesn’t turn off the graphql OpenTelemetry you’ll need to remove the plugin options for that to happen. The apiSdk option should point to the js file which is loaded before your application code to setup the OpenTelemetry SDK. You will likely want to leave this as the default value.
SDK File
The api/src/opentelemetry.js|ts file generated by the setup command is where the OpenTelemetry SDK is defined. For more information on the contents of this file - including what options you may wish to edit to suit your own needs - please see the documentation at Instrumentation | OpenTelemetry.
Availability
The setup command is currently available from the canary version of Redwood. You can try this out in a new project by running yarn rw upgrade --tag canary and following any general upgrade steps recommend on the forums.
Limitations
Currently we are only supporting OpenTelemetry from the “api” side of Redwood but we aim to add the “web” side soon.
We also at the moment only support OpenTelemetry during development, that is yarn rw dev will automatically enable OpenTelemetry when you have it setup and enabled within the TOML. Other commands like yarn rw serve do not currently do this but we hope to add this in the future too.
Known Issues
There are a few know issues which we will be addressing shortly:
- Services which return a promise but that are not marked as
asyncdo not have the correct timings reported.
Feedback
Please leave feedback as comments to this forum post. We would love to hear what’s broken, what isn’t clear and what additions or changes you’d like to see!
We would also welcome any form of collaboration on this feature!


