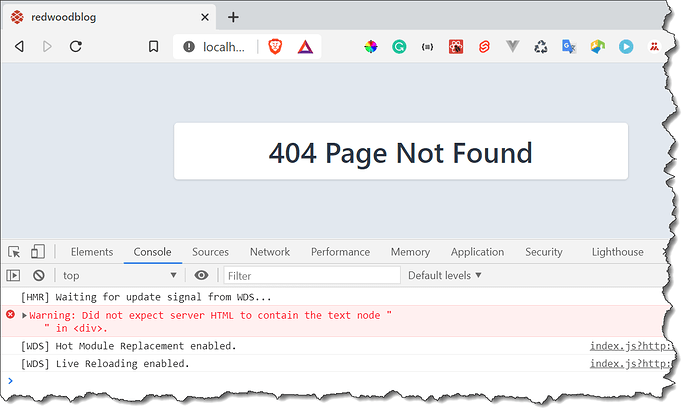
At the moment, I have two open topics (Redwood application debugging issues 90 views) and Development tools usage poll 74 views) both, gaining relatively low attention. So this topic introduces a bit more interesting content - while all three serve the same purpose: raise the level of debugging sophistication, a discipline that can lower productivity of a developer by a lot.
In order to create a good collection of bugs that took a lot of time and by the consequence make good cases for using the state of the art debugging tools, I will add the first addition to this collection - a typo that kept me annoyed for a few days (not full days, as I got mad on myself how the heck can I spend more than a few minutes on such trivial issue). The biggest problem for me is not being used to React programming, so the still most often used debugging tool (console.log) seems not easy to use (where to place it).
Case 1
Trying to help verify that the Redwood Tutorial accuracy is as high as the usefulness of the document (great job @cannikin), I kept typing the code and verifying its function after each section. So, I added the section Routing Params and tried to run the app:
What to do here? The most obvious tack would be to have a peek at the app’s URL - but since I use Chrome with many tabs open, narrowing the URL field, that did not occur to me.
The second best thing would be to use the React Components section of the Chrome Developer Tools
This wasn’t too inviting for someone who never saw the UI for debugging React app
At this point I looked at the URL:
http://localhost:8910/blog-post%7Bid:Int%7D?id=1
By now, any React developer with his/her salt would know what caused this behavior - but as I am a greenhorn (novice), i will show you in my next update what was the problem, that I found just by starring into the code.

